TradingView Review
TradingView is a leading technical analysis platform. But is it worth the subscription fee? Read on to find out.
Overall Score | 4.3 | ||
Customer Service | 3.0 | ||
Ease of Use | 5.0 | ||
Online Community | 5.0 | ||
Performance | 4.5 | ||
Research | 4.0 | ||
Pros and Cons
- Key features are free
- Active trading community
- 1-month free trial
- Mobile alerts sometimes aren't sent
- Delays in the market movement
Bottom Line
Technical analysis charting platform for traders
TradingView is a premier platform that offers charting tools and a social network for traders and investors. Its subscription plans offer a wide range of features that can help you find profitable trading opportunities.
However, a lot of these features are offered in the free plan. So, would a monthly subscription be worth it?
In this review, learn about the key features along with the pros and cons of TradingView's Plus plan and see if a subscription would fit your needs.
What Is TradingView?
TradingView is a market-leading technical analysis charting platform used by more than 60 million traders and investors.
It offers a wide range of trading tools and allows the trading of various assets. It also has an active community of traders with whom you can exchange trading ideas.
Yes, TradingView offers a free plan that allows you to use its trading tools and analysis features. Some of it is limited, but it's a good start if you want to experience what TradingView has to offer.
Who Is TradingView Best For?
 |
TradingView is best for:
- Traders who rely on technical analysis
- Beginner traders who want to study the charts
- Traders who want to backtest a strategy
- Traders who are looking for a trading community
- Investors who want to know the best point of entry
Yes, TradingView is good for day trading because of features like charting and analysis tools, customizable alerts, and paper trading. It's also good for swing trading, scalping, and any trading style that involves technical analysis.
Who Should Skip TradingView?
If you're a trader or investor who primarily relies on fundamental analysis, you should probably skip TradingView. You won't benefit from a lot of the tools it offers.
You should also skip TradingView if you're a long-term investor. You might not need the advanced charting and real-time data that TradingView offers.
Pros and Cons
Pros
- Key features are offered free on its Basic plan
- Has an active trading community
- Paid plans have a 1-month free trial
Cons
- Trading alerts are sometimes not sent on mobile
- There is a delay of a few seconds in the market movement
Pricing
There are 4 types of plans for a retail trader in TradingView: Basic, Essential, Plus, and Premium. While some traders earn well even with the Basic plan, some benefit from upgrading their accounts.
Here's a breakdown of the four plans's major features:[1]
- Basic: Free
- Essential: $14.95/month or $155.40/year
- Plus: $29.95/month or $299.40/year
- Premium: $59.95/month or $599.40/year
| Basic | Essential | Plus | Premium | |
|---|---|---|---|---|
| Bar Replay | ❌ | ✔ | ✔ | ✔ | Ad-free | ❌ | ✔ | ✔ | ✔ |
| Charts Layout | 1 | 2 | 4 | 8 |
| Indicators per chart | 2 | 5 | 10 | 25 |
| Historical Bars | 5K | 10K | 10K | 20K |
| Price Alerts | 5 | 20 | 100 | 400 |
| Technical Alerts | 1 | 20 | 100 | 400 |
| Parallel Chart Connections | 2 | 10 | 20 | 50 |
Most of the important features are paywalled, such as the Bar Replay, historical data, multiple alerts and indicators, etc. So, consider upgrading to paid plans if you think these are crucial to your trading analysis.
It's best to start with the Basic plan, their free plan. It's useful enough to effectively analyze charts, especially if you're using price action, trend following, or any trading strategy that doesn't involve the use of more than two indicators simultaneously.
Are TradingView's Paid Plans Worth it?
Yes, TradingView's paid plans are worth it if you're an active trader who relies on technical analysis. All these extra tools at your disposal could help you earn back the subscription cost in no time.
Upgrading to paid plans to study the markets is a good idea. However, you must also consider the size of your trading account and how profitable you are to remain practical.
The Essential plan can cost as little as $155.40/year. To break even, you need at least $1,560 in capital and a 10% annual investment gain. Of course, it'd be easier if you had bigger capital and gains.
Key Features of TradingView's Paid Plans
At TradingView, you can do sufficient trading analysis through its free features alone. But in the Essential plan, there's Bar Replay, no ads, and up to 20 price and technical alerts. Its 5 indicators per chart are also decent if you have a simple trading plan.
If you're using Intraday Renko, Kagi, Line Break, Point & Figure charts, you need to upgrade to the Plus plan. In this plan, there are more indicators per chart, chart layout, and alerts. You can also start exporting data.
But when you need all the data and features you can get, upgrade to the Premium plan.
| Essential | Plus | Premium | |
|---|---|---|---|
| Volume Profile | ✔ | ✔ | ✔ |
| Custom timeframes | ✔ | ✔ | ✔ |
| Custom range bars | ✔ | ✔ | ✔ |
| Multiple watchlists | ✔ | ✔ | ✔ |
| Bar replay | ✔ | ✔ | ✔ |
| Indicators on indicators | ✔ | ✔ | ✔ |
| Intraday Renko, Kagi, Line Break, Point, and Figure charts | - | ✔ | ✔ |
| Charts based on custom formulas | - | ✔ | ✔ |
| Chart data export | - | ✔ | ✔ |
| Auto-chart patterns | - | - | ✔ |
| Second-based alerts | - | - | ✔ |
| Non-expiring alerts | - | - | ✔ |
| Publishing invite-only scripts | - | - | ✔ |
| Second-based intervals | - | - | ✔ |
Charting Tools
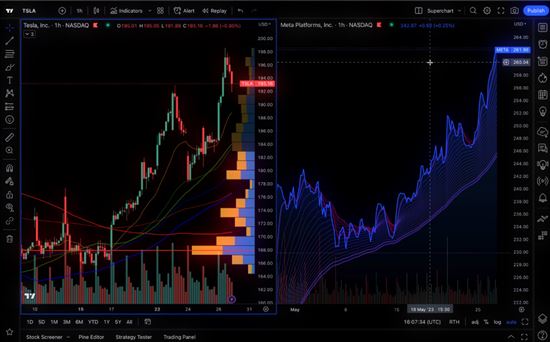 |
TradingView is known for its Supercharts which is regarded as one of the best charting platforms in the world. Here are some of the charting tools that you'll get in Supercharts:
- 400+ built-in indicators and strategies
- 100,000+ public indicators
- 110+ smart drawing tools
- 20+ chart types
- 20+ default timeframes (or custom timeframe for Premium plan holders)
The main difference between the free plan and the paid plan is the number of charts that can be opened on a single screen. The free plan lets you open 1 chart, while the paid plans allow up to 8.
Being able to open multiple charts on a single screen is extremely beneficial if you're doing multi-timeframe analysis. With one look, you can see the trend across different timeframes. Each opened chart can have varied timeframes and indicators. You can also customize the timeframes and range bars with all the paid plans.
Bar Replay
TradingView's Bar Replay lets you see historical chart data as if it were being streamed live, allowing you to make realistic decisions during backtesting and simulation.
You can control the auto-replay speed however you'd like, or you can manually forward the data feed. This is perfect for traders who want to test a new trading strategy risk-free.
Technical Analysis
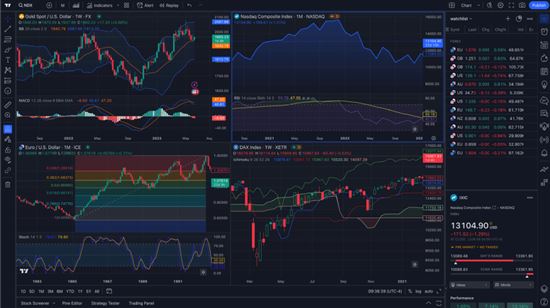 |
Aside from common indicators such as Moving Averages and Fibonacci, TradingView also offers strategies like MACD, Channel Breakout, and RSI to help you spot trade entries and exits.
Auto-pattern recognition features in TradingView will also help you spot trends and reversals. These include chart formations like Bearish and Bullish Flags, Head and Shoulders, and candlestick patterns like the Hammer, Shooting Star, and Marubozu.
Plus, you can code your own custom indicators or automate your trades using Pine Script, TradingView's programming language.
You can also explore the 100,000+ public indicators created by other users. Browse through the popular scripts or editor's picks. These include custom indicators or visualization of other methods such as Monte Carlo, Ehlers Loops, or Ichimoku.
TradingView's free plan gives you most of the trading tools available on the paid plans. The main difference is the number of indicators you can use on one chart—free plans let you use only 2, while paid plans offer up to 25.
Alerts
TradingView's alerts are server-side, so even if you're offline, you'll still get notifications via pop-up or push notifications, emails, or SMS on your device.
You can set alerts for a specific price, indicator, drawing, or trading strategy. Once triggered, you'll be notified. TradingView's paid plans offer up to 400 price and technical alerts.
Screeners
TradingView offers a unique screener for each product: stocks, forex, ETFs, crypto, and bonds. Among its features is a technical rating that tells you if an asset is a "Strong Buy" or a "Strong Sell."
You can use these screeners to filter the market based on your chosen parameters, such as income statement details, performance, dividends, valuation, margins, or oscillators.
Each screener has a unique set of filters. For example, you'd also find sentiment data in the crypto coins screener. This data includes the number of Telegram subscribers and the number of positive or negative tweets on X.
Those who are subscribed to Premium can export chart and screener data, which is saved to a CSV file.
Fundamental Data
You'll like this feature if you use fundamental data alongside your technical analysis. TradingView offers a visualization of fundamental data from balance sheets and income statements on a chart.
When you open a stock chart, you can add figures like revenue or dividend yield to a chart window. This lets you analyze market performance after company news or earnings announcements.
Community
Join a community of over 60 million traders and investors on TradingView, where you can improve your trading skills. Learn from its four main sections: Trade Ideas, Education Ideas, Video Ideas, and Pine Script Tutorials.
At Trade Ideas, you can read an analysis of a specific asset written by other users. And if you want a visual explanation of the charts, just browse through Video Ideas.
With Education Ideas, you'll learn valuable skills, from risk management to best practices in trading. As a trader, you need to master not only the technicalities but also the psychological aspects of investing to make better decisions.
Join group chats for your chosen market to connect with other traders easily. You can participate in as many or as few of these chats as you like. You can also send private messages if you want to discuss something one-on-one.
Assets
Aside from being a user-friendly technical analysis platform, TradingView is known for its wide range of assets and markets.
TradingView supports over 2 million instruments from all over the world. It provides direct access to 100+ global stock and futures exchanges, 50+ major crypto exchanges, global currency pairs, and worldwide indexes.[2]
TradingView also supports other assets such as government and corporate bonds, ETFs, and economic indicators like GDP.
Market Data
TradingView displays free real-time US stock data from the Cboe exchange. You can subscribe separately to a primary exchange like NASDAQ to get even more accurate real-time data.
You can buy just one data feed or a bundle. For example, the US Stock Markets bundle contains access to 5 data sources: NASDAQ, NASDAQ GIDS, OTC MARKETS, NYSE, and NYSE ARCA.
If you're already subscribed to real-time data through your broker, just link your trading account. Verification time for supported markets is up to 7 days.[3]
News
TradingView has a News feature that streams the latest news from media outlets like Reuters, Cointelegraph, and InvestorPlace.
There's also the Snaps feature. This gives you the latest news from stocks and crypto traders who have posted snapshots.
Educational Content
TradingView provides streams of educational content and trade ideas from the community. You can watch videos if you want to learn more about a trading strategy or a trading style.
There are also videos for live trading and market analysis from trading experts.
Broker Integration
TradingView has over 50 brokerage connections: OANDA, FOREX.com, Interactive Brokers, Webull, TradeStation, Tradovate, StoneX, Gemini, and more.
These connections let you integrate your preferred broker with TradingView, allowing you to trade directly from the platform after analyzing the charts.
Yes, you can trade directly from TradingView because it has connections with over 50 different brokers. If your preferred broker is connected to TradingView, you can place market orders directly from the TradingView platform.
Other TradingView Features
Here are the other notable features of TradingView:
- Chart data export
- Backtesting
- Paper trading
- Sparks (TradingView's curated watchlist)
- Heatmaps
- Gainers and losers summary
- Community trends
- User-friendly interface
- Website, desktop, and mobile app
TradingView User Interface
TradingView is known for its user-friendly interface. It's packed with technical analysis tools, yet it is still easy to navigate and beginner-friendly.
Its mobile app offers almost everything that the website and desktop platform provide, allowing you to easily manage your trades on the go. You can even sync your charts so you don't have to repeatedly add drawing objects while charting.[4]
Yes, TradingView data is accurate. Its free stock data from the Cboe exchange may differ slightly from primary exchanges but is not noticeable on higher timeframes. You can, however, purchase a subscription to a primary exchange like NASDAQ for even more accurate data.
Is TradingView Secure?
Yes, trading through TradingView is secure. Technically, TradingView is a technical analysis platform, but you can trade here if you choose to integrate your broker.
If you choose to integrate your broker, it will go through a secure, encrypted API that does not share your data with third parties. So, TradingView won't have access to or store your personal login information, such as your username or password.
As for customer complaints, they are pretty responsive to those filed on their BBB page, especially if they are related to incorrect charges or refunds.
While TradingView is not a perfect platform, some users who have been with them for a long time appreciate the upgrades they have made over time based on feedback provided through discussion boards like Reddit.
With millions of users continuously using this platform, there is a high chance that TradingView can be trusted. For added security, a secure, encrypted API is used between TradingView and your chosen broker during integration, protecting your personal account information.
Customer Support
Unfortunately, TradingView doesn't have a public number or email. Paid plan users, can get support from TradingView's Customer Success team by submitting a support ticket and selecting a category of concern. From there, you'll be asked a series of questions to pinpoint your specific concern.
Although TradingView is the best technical analysis platform on the market, MetaTrader 5 and NinjaTrader can be good alternatives.
User Testimonies
Here are some user testimonies from users of TradingView, reviewed on Trustpilot:
Alternatives to TradingView
Not sure if TradingView is the right fit for you? MetaTrader 5 or Ninja Trader may be good alternatives.
MetaTrader 5
MetaTrader 5 is also a technical analysis trading platform with highly customizable graphs. It offers 38 technical indicators, which is much less than TradingView's 100.
MetaTrader 5 also offers a range of timeframes. The shortest one minute timeframe is available, while TradingView offers timeframes as short as one second.
Both MetaTrader 5 and TradingView allow the trading of a wide range of assets like cryptocurrencies, indices, commodities, currencies, and stocks.
NinjaTrader
Like TradingView, NinjaTrader offers a wide range of charting options. It has over 100 indicators, analytical features, and tools. NinjaTrader also lets you create your own technical indicators.
It also has a replay feature for backtesting strategies and a large community of traders with whom you can discuss trade ideas. You can also trade a wide range of assets.
Bottom Line
TradingView can be an extremely useful technical analysis platform, especially if you're an active technical trader. Its paid plans are particularly useful if you're doing multi-timeframe analysis.
If you want to try it out, there's a free plan that offers some of its key features. It's limited, but it's good enough to try out the indicators, timeframes, and drawing tools.
There's also a one-month free trial for its paid plans, letting you experience the full range of tools and services TradingView offers.
References
- ^ TradingView. Plans for every level of ambition, Retrieved 01/21/2025
- ^ TradingView. Market Data, Retrieved 01/01/2025
- ^ TradingView. How can I get real-time data from exchanges that I have already purchased with my broker?, Retrieved 01/01/2025
- ^ TradingView. Instant synchronization of drawing objects, Retrieved 01/07/2025
Fund Account and Get Up to $12,000 Bonus
Open a new eligible Webull account. Fund the account with one or more qualifying deposits totaling $5,000 or more. Maintain a net qualifying funding amount of at least $5,000 in the account until the payment of the final installment of the offer reward. The offer reward will be credited to the eligible Webull account in 12 equal monthly installments, with the first installment issued within 45 days after the end of the offer period. To participate in this offer, you must click “Enroll Today” on the website. Terms and conditions apply.
| Net Qualifying Funding Amount | Offer Reward Amount |
|---|---|
| $5,000 - $25,000.99 | $100 |
| $25,001 - $100,000.99 | $750 |
| $100,001 - $250,000.99 | $1,500 |
| $250,001 - $500,000.99 | $3,750 |
| $500,001 - $1,000,000.99 | $5,000 |
| $1,000,001 - $5,000,000.99 | $8,000 |
| $5,000,001+ | $12,000 |
Invest and Earn $150 Bonus
Open a new account using promo code TSTVAGLL. Fund the account with new and qualifying assets of $5,000 or more. Maintain a balance of $5,000 or more in the account for 60 days.
Get up to $250 in Futures Commission Rebates
Open and fund a NinjaTrader account & receive up to $250 in commission rebates* for trades placed within 30 days of fund date.
$20 Investment Bonus
- Open an Acorns account (new users only)
- Set up the Recurring Investments feature
- Have your first investment be made successfully via the Recurring Investments feature
Write to Del Exconde at feedback@creditdonkey.com. Follow us on Twitter and Facebook for our latest posts.
Note: This website is made possible through financial relationships with some of the products and services mentioned on this site. We may receive compensation if you shop through links in our content. You do not have to use our links, but you help support CreditDonkey if you do.
|
|
|
Compare:


