Study: Safest Cities for Your Wallet and Well-Being
Large cities tend to have a reputation for high crime. Walk among high rises, and you may feel a need to frequently check for your wallet or hold your purse more tightly. While it's always good to be cautious wherever you are, we have found that the crime-ridden reputation of the city life – at least for some major metropolitan areas – don't ring true everywhere.
We ranked large U.S. cities on three types of crime and found that most fall below the national median in at least one of the three categories – many in two or even in all three. In fact, some of the cities on this list have less crime per 1,000 people than some rural areas. Read on to see our list of some of the safest major cities in the country (then take a look at our ranking of the Cities with the Most Crime).
Study Methodology
- Violent crimes per 1,000 people (% differential from median)
- Total crimes per 1,000 people (% differential from median)
- ID Theft per 1,000 people (% differential from national average)
To assemble the rankings, we looked at three types of crime – violent crime, total crime, and ID theft – in cities with populations over 500,000. We gave violent crime the largest weight when we scored the cities, counting it twice as much as other types of crime (which we call “total crime”) and four times as much as ID theft. Included in the violent crime category are murders, forcible rapes, robberies, and aggravated assaults. Total crime includes all violent crimes, as well as property crimes, burglaries, thefts, and arson. We held up all the figures against national roundups to give a true picture of those that fall below the average (which in this case is a good thing).
Safest Big Cities for Your Wallet, Well-Being
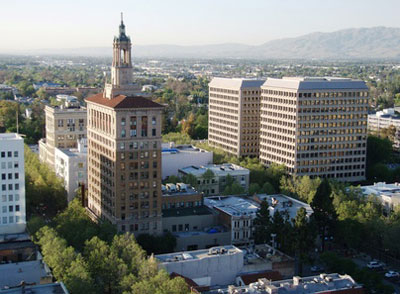
1. San Jose, CA
 |
| San Jose, California |
- Violent crime % differential from median: -21%
- Total crime % differential from median: -23%
- ID Theft % differential from national average: -21%
San Jose earns the top spot because it’s the only large city in the country to fall more than 20 percent below the national benchmark in all three categories. It also holds the distinction of having the lowest incidence of violent crimes per 1,000 people among all cities with populations over 500,000 considered for these rankings.
What you may not know about San Jose: In response to budget, staff, and crime concerns of late, the city of San Jose launched the RCITI (pronounced “our city”) program in early 2013 to reaffirm the police department’s core priorities. Reducing gang-related crimes and being responsive to residents’ needs are among the program’s key goals. The city reports that gang-related crime fell 28 percent during the first three months of 2013 compared to the same period last year.
2. San Diego, CA
 |
| San Diego, California |
- Violent crime % differential from median: -12%
- Total crime % differential from median: -32%
- ID Theft % differential from national average: -16%
San Diego actually has a lower incidence of crime as a whole than San Jose, but it ranks behind its in-state neighbor because it has higher violent crime occurrences. Still, the statistics for San Diego are impressive considering it’s one of only three cities in the top 10 to have a population greater than 1 million.
What you may not know about San Diego: The city has promoted the concept of neighbors watching neighbors by partnering with Nextdoor.com, a San Francisco-based social network for neighborhoods. Each community has its own website that only those residents can access. They can exchange information about what they’re seeing in their neighborhood, including safety issues.
3. El Paso, TX
 |
| El Paso, Texas |
- Violent crime % differential from median: -10%
- Total crime % differential from median: -32%
- ID Theft % differential from national average: -12%
The first three cities on this list are the only ones that fall below the national benchmark in all three categories, and El Paso is the last of that group. Its violent crime and total crime differentials are third and tied for fourth best, respectively, among all the cities we considered.
What you may not know about El Paso: El Paso is right on the Mexican border, and the police department has to be especially vigilant to try to prevent Mexico’s high occurrence of drug crime from seeping across it. Of particular concern are “stash houses” that act as temporary drug warehouses to facilitate widespread distribution.
4. Los Angeles, CA
 |
| Los Angeles, California |
- Violent crime % differential from median: +3%
- Total crime % differential from median: -33%
- ID Theft % differential from national average: +21%
Fourth place goes to Los Angeles largely because it has the second best total crime differential while also having the second largest population. It’s the first city in the top 10 to have more violent crime occurrences per 1,000 people than the U.S. median, but at only +3%, it scores better than most U.S. cities including many of those on this list.
What you may not know about Los Angeles: Crime in Los Angeles has declined over the past decade, particularly the number of incidents involving gangs. The city has two programs that aim to keep youth out of trouble. The A.C.T. program (Abolish Chronic Truancy) looks to spot patterns of truancy as early as possible and coordinate the efforts of administrators, teachers, parents, and students to fix it. And the S.A.G.E program (Strategy Against Gang Environment) educates parents on recognizing signs of early involvement in gangs, improving neighborhoods, and diverting the attention of kids away from gangs.
5. New York, NY
 |
| New York, New York |
- Violent crime % differential from median: +29%
- Total crime % differential from median: -48%
- ID Theft % differential from national average: +5%
By far the largest city in the top 10 with a population of over 8 million, New York ranks fifth because its relative total crime differential is the second most favorable among the metropolitan areas evaluated despite having a higher incidence of violent crime than all but one other city on this list (Tucson).
What you may not know about New York: Reducing crime has been a main priority of Mayor Michael Bloomberg since he took office more than a decade ago. A number of initiatives – some more controversial than others – have been launched during his tenure. Among the most recent is the Juvenile Robbery Prevention Program, which identifies at-risk youth and uses early intervention to dissuade them from committing additional crimes.
6. Denver, CO
 |
| Denver, Colorado |
- Violent crime % differential from median: +12%
- Total crime % differential from median: 0%
- ID Theft % differential from national average: -10%
There’s nothing remarkable about Denver’s statistics, which explains why it’s toward the middle of the top 10. It’s right in line with the national median in total crime, and its violent crime differential is almost exactly balanced by its ID theft differential.
What you may not know about Denver: The city is in the process of archiving and cataloging artifacts and memorabilia from historic enforcement efforts in the Denver Police headquarters, which can be accessed by the public. These items make up what the city calls the Denver Police Museum, which includes preserved images on its website.
7. Tucson, AZ
 |
| Tucson, Arizona |
- Violent crime % differential from median: +51%
- Total crime % differential from median: -72%
- ID Theft % differential from national average: -12%
Tucson is the smallest city in the top 10 with a population just north of our 500,000 cutoff. It also has the distinction of having both the highest incidence of violent crime and the lowest incidence of total crime relative to the national median – a unique statistical anomaly.
What you may not know about Tucson: The top vehicle stole in the area in 2012 was the Honda Accord, followed by the Honda Civic, according to the city’s website. So if you drive one of those cars and you find yourself on any of these roads in Tucson, you may not want to leave your vehicle unattended: E. Broadway Boulevard, E. Fort Lowell Road, and E. Wetmore Road. Each of these streets had three stolen cars in one month in 2012.
8. Austin, TX
 |
| Austin, Texas |
- Violent crime % differential from median: -8%
- Total crime % differential from median: +49%
- ID Theft % differential from national average: -16%
A total crime differential of 49% gives Austin the highest relative incidence of crime in the top 10, but it’s also one of only four major cities to have fewer violent crime occurrences per 1,000 people than the national median.
What you may not know about Austin: The police department promotes neighborhood watches, home and business security surveys, and Walkers on Watch programs. The goal of these initiatives is to educate everyone who lives or works in the area on crime prevention and encourage them to be alert to potential issues.
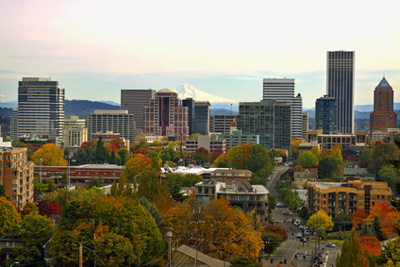
9. Portland, OR
 |
| Portland, Oregon |
- Violent crime % differential from median: +11%
- Total crime % differential from median: +48%
- ID Theft % differential from national average: -41%
Portland is the second smallest city in the top 10 yet still has one of the higher relative crime incidences. It’s +48% differential in the total crime category puts it toward the bottom of the list despite its -41% ID theft differential being among the best of major U.S. cities.
What you may not know about Portland: The city’s Enhanced Safety Properties program just had its eighth birthday and has grown from including only seven properties at its launch to over 150 properties citywide. The program encourages landlords to promote safety and livability for their tenants by providing them with training and a set of standards that they and their employees must meet to be certified as an ESP property.
10. Louisville, KY
 |
| Louisville, Kentucky |
- Violent crime % differential from median: +26%
- Total crime % differential from median: +25%
- ID Theft % differential from national average: -42%
Louisville has the lowest incidence of ID theft among all the cities we ranked. Unfortunately, it’s well above the national median in both violent and total crime per 1,000 people, which keeps it at the very bottom of the top 10.
What you may not know about Louisville: Cops in this city apparently want to keep their strong ranking in the low number of identity thefts. Over the summer, the Louisville Metro Police Department took part in a day-long training hosted by the FBI Law Enforcement Executive Development Association and ID theft protection company LifeLock. The police chiefs, sheriffs, and other law-enforcement personnel invited to the event were encouraged to bring information from active cases for discussion.
In general, larger cities have a reputation for having more crime than smaller cities that have much fewer people. While our list has pulled out the safer cities, there are areas of these cities that are safer than others. Our list is not wholly comprehensive: A lack of crime data prevented the cities of Chicago, Indianapolis, Washington, D.C., Oklahoma City, and Albuquerque – all which go over the 500,000 population threshold – from factoring into these rankings. The medians in the violent and total crime categories were calculated based on nationwide U.S. crime data, which includes about 260 cities. The national average for ID theft was calculated based on the total number of ID theft complaints in 2012 and the U.S. population as a whole, resulting in a national average for incidences per 1,000 people. Other types of white collar crime, including fraud and most types of Internet crime, were not factored into these rankings.
Sources
- FBI Crime in the United States Jan-June 2012 semiannual report
- FTC Consumer Sentinel Data Book 2012
Leah Norris is a research analyst at CreditDonkey, a credit card comparison and reviews website. Write to Leah Norris at leah@creditdonkey.com. Follow us on Twitter and Facebook for our latest posts.
Note: This website is made possible through financial relationships with some of the products and services mentioned on this site. We may receive compensation if you shop through links in our content. You do not have to use our links, but you help support CreditDonkey if you do.